What Are the Top 10 New Sedan Cars in China?
China’s sedan market is moving quickly. New models arrive with larger screens, quieter cabins, faster charging, and more driver-assistance features. Yet a glossy launch photo cannot tell you how a car feels after a long commute or a week of family errands.
For this guide to the Top 10 New Sedan Cars in China, we compare practical factors: price, powertrain, cabin space, safety equipment, comfort, and ownership support. Bill Russo, founder of Automobility, has described China as “the most competitive automotive market in the world.” That context matters. Carmakers compete on technology, but also on the details drivers notice: rear-seat knee room, clear controls, and usable charging access. Small things count.
The list aims to help readers compare new sedan cars, not declare one universal winner. Model availability, trim specifications, and prices can change by city and over time, so buyers should verify current details with manufacturers and dealers. A ranking also has limits. Road tests and owner experience can differ, and a quiet showroom is not a crowded highway. No ranking is perfect. Still, looking closely at the leading launches can show where China’s sedan market is heading—and which features may genuinely improve daily driving.
Define China’s New-Sedan Segment and CPCA’s Retail-Ranking Method
In this article, “China’s new-sedan segment” means passenger sedans sold at retail in mainland China during the stated reporting period. “New” describes newly purchased vehicles, not only models launched recently. The scope excludes SUVs, MPVs, and commercial vehicles. A clear definition matters because body styles and model labels can vary across data sources. That distinction matters.
The ranking uses CPCA retail figures, rather than factory output, wholesale shipments, or export totals. Retail sales offer a closer view of vehicles reaching buyers, though they do not reveal every owner’s experience. Each list should identify its month or year, market scope, and unit of measurement. It should also explain whether trims and closely related versions are counted together under one model name. Not every list agrees. Small differences in naming or classification can shift a car’s position, especially when sales are close. CPCA figures are useful evidence, but readers should check the period and category before comparing rankings. A single month can be noisy.
Set the Market Context: CAAM Reports 31.436 Million Vehicle Sales in 2024
China’s auto market recorded 31.436 million vehicle sales in 2024, according to the China Association of Automobile Manufacturers. That figure sets the scale for any discussion of new sedans. It is a national total, not a sedan count. A vast field.
Those sales reflect varied needs: weekday traffic, tight parking spaces, family trips, and comfortable rear seats. For sedan shoppers, these details can matter more than a headline ranking. A car that feels composed on a smooth test route may seem less convincing on rough pavement or in slow traffic. Small things count: door clearance, seat support, clear controls, and a trunk that fits real luggage.
CAAM’s figure also has limits. It cannot show which body styles gained ground or how buyers divided purchases by price. Those questions need segment-level data and direct testing. Numbers offer context, not a verdict. Rankings can be imperfect, too; testing conditions and personal needs rarely line up neatly.
Rank the Top 10 Sedans by CPCA 2024 Retail Sales
A CPCA 2024 retail-sales ranking offers a practical way to compare China’s ten leading new sedans. It orders cars by units purchased by retail customers during the year, not by wholesale shipments or factory output. That distinction matters: a vehicle delivered to a dealer is not necessarily a customer sale. Read the positions from No. 1 to No. 10, and treat each place as a measure of sales volume, not a verdict on comfort, safety, or value.
The highest-ranked cars show which choices reached the most buyers, while the lower places still represent substantial demand. Compare the ranking with your own needs: cabin space, fuel or charging access, and typical commute length can matter more than a small gap in annual sales. Retail totals also reflect price changes, new launches, and availability. A strong rank cannot tell you how a car feels on a rough city street, or whether its rear seat suits your family.
Tips: Check that every figure covers the same calendar year and retail-sales definition. Use the ranking as a starting point, then inspect current specifications and take a test drive. Small details count. A firm seat or limited rear visibility may change your choice.
Compare Powertrains Against CAAM’s 12.866 Million NEV Sales in 2024
In 2024, China sold 12.866 million new-energy vehicles (NEVs), up 35.5% year on year, according to the China Association of Automobile Manufacturers (CAAM). Against 31.436 million total vehicle sales, NEVs represented about 40.9%. That is a major shift. A top-ten sedan comparison should weigh charging access, winter efficiency, battery size, and usable electric range—not acceleration alone.
Powertrain choice changes what “best” means. Battery-electric sedans suit drivers with reliable home or workplace charging and predictable routes. Plug-in hybrids offer electric commuting with fuel backup for longer journeys.
Range-extended models bring another compromise: an onboard engine generates electricity, but added hardware can mean more weight. Highway efficiency may disappoint. CAAM’s NEV total covers more than sedans, including different vehicle types and powertrains.
The International Energy Agency’s Global EV Outlook 2025 estimates that China’s electric-car sales exceeded 11 million in 2024. Its passenger-car scope differs from CAAM’s broader NEV tally, so the figures should not be combined. For sedan rankings, compare independent road-test range, rapid-charging performance, and real-world energy use. Brochure numbers can mislead. I would also question rankings that assume every driver has the same commute or charging routine.
Evaluate Range, Safety, and Ownership Costs Using Official Test Data
A useful top-ten comparison starts with the test conditions, not the biggest advertised range. Official range figures should be checked against the stated test cycle, vehicle configuration, and wheel size. Those details matter. A sedan tested with smaller wheels may not match the version in a showroom. Compare like with like, and treat laboratory range as a reference rather than a promise for every commute.
Safety needs the same care. Review official crash-test results, active-safety performance, and the standard equipment fitted to each trim. A feature listed only on an expensive version should not earn credit for the whole model. Check how protection is assessed, too; different test programs may use different procedures. Numbers are useful, but they do not tell the whole story.
Ownership costs are less tidy. Use published energy-consumption results, service schedules, warranty terms, and available insurance estimates to build a consistent comparison. Include tire replacement and routine maintenance where reliable figures exist. Avoid presenting uncertain costs as exact savings. A small difference in official consumption can add up over years, but local electricity prices and driving habits change the result. I would keep a note beside every estimate. A spreadsheet can still miss the quiet annoyance of frequent charging stops or a costly tire size. Official data offers a sound starting point, not a perfect forecast.

 T5EVO
 T5L
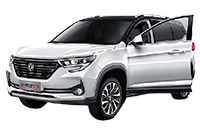 T5
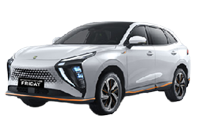 Friday
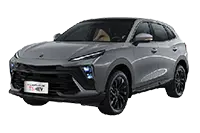 T5 HEV
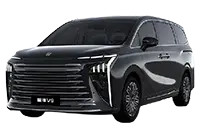 V9
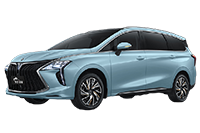 UTOUR (M4)
 M5 EV
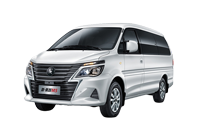 M5
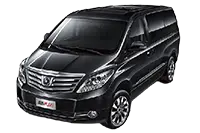 Lingzhi Plus
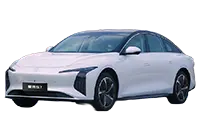 S7
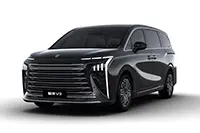 V9 HEV
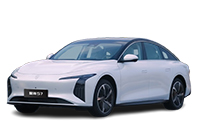 S7
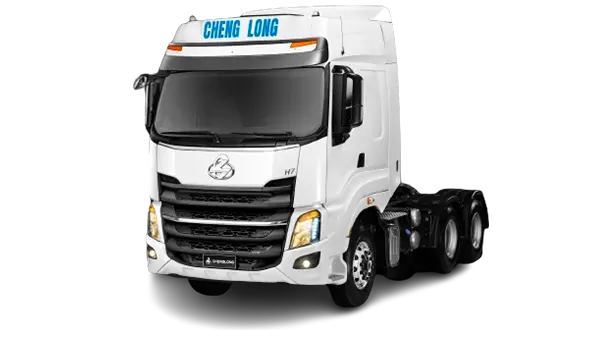 6X4 H7 Tractor
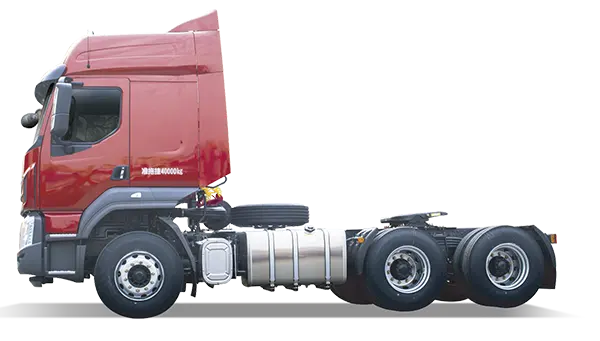 6X4 H5 Tractor
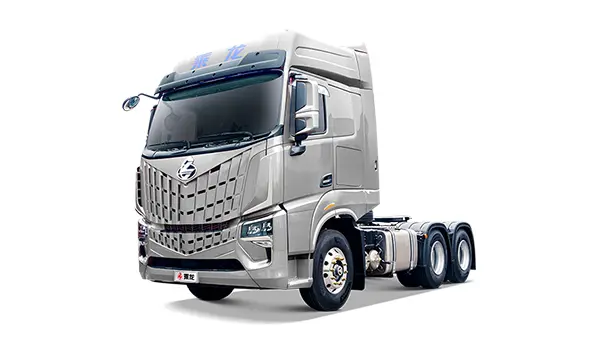 6X4 HK Tractor
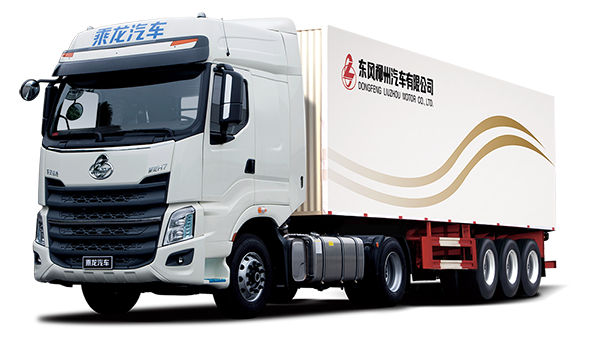 4X2 H7 Tractor
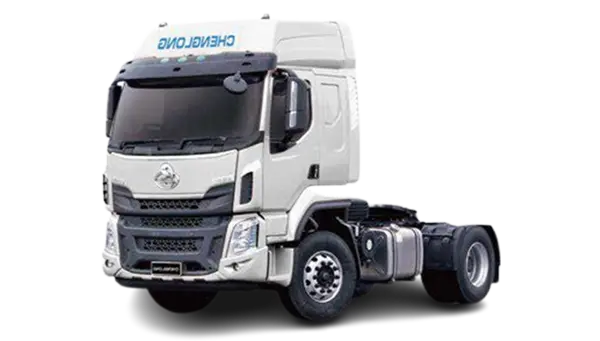 4X2 H5Tractor
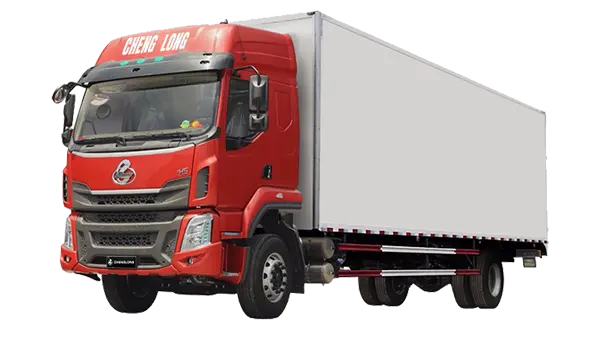 4X2 H5 Cargo Truck
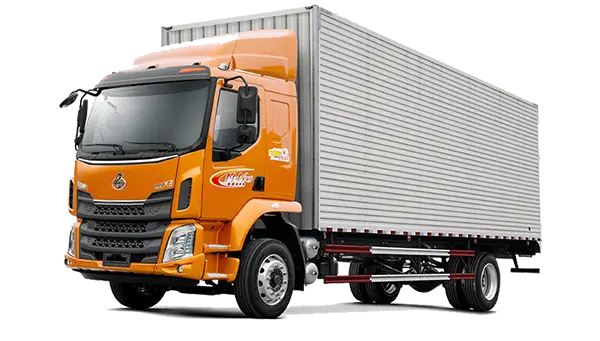 4X2 M3 Cargo Truck
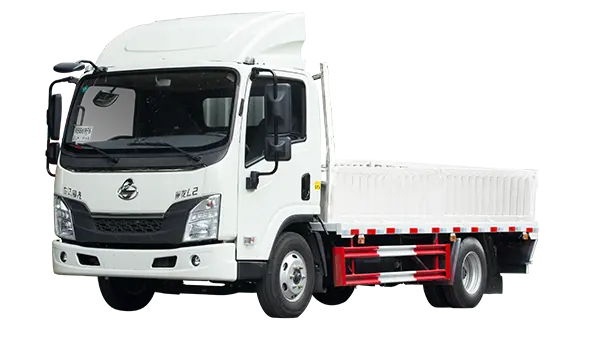 4X2 L2 Cargo Truck
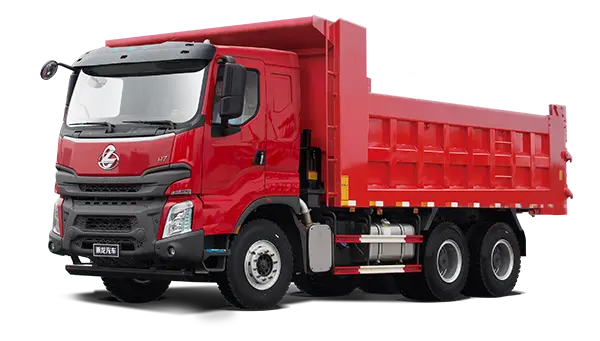 6X4 H7 Dump Truck
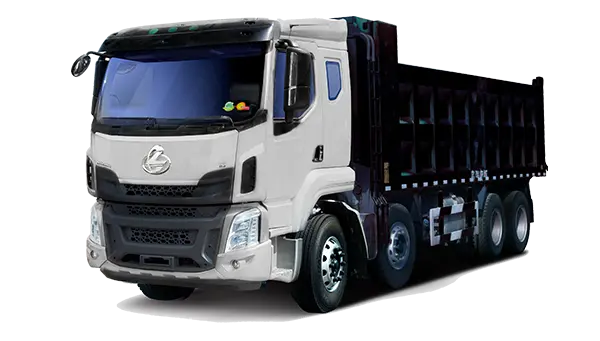 6X4 H5 Dump Truck
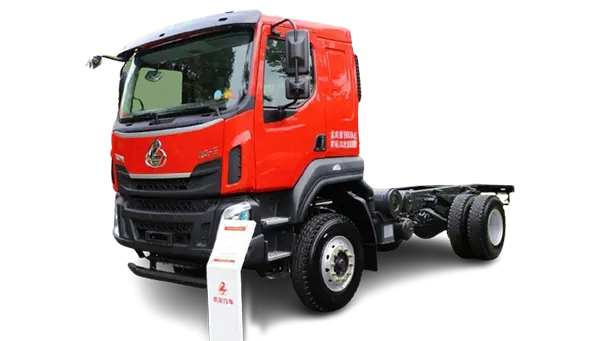 4X2 H5 Dump Truck
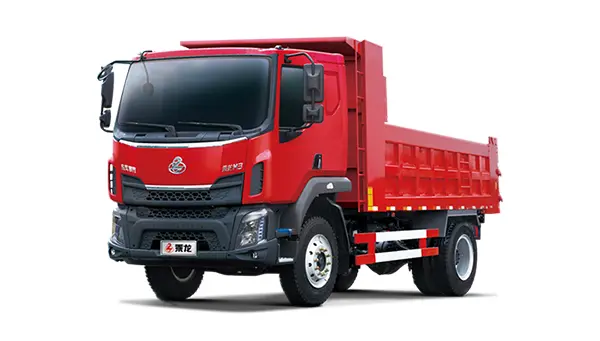 4X2 M3 Dump Truck
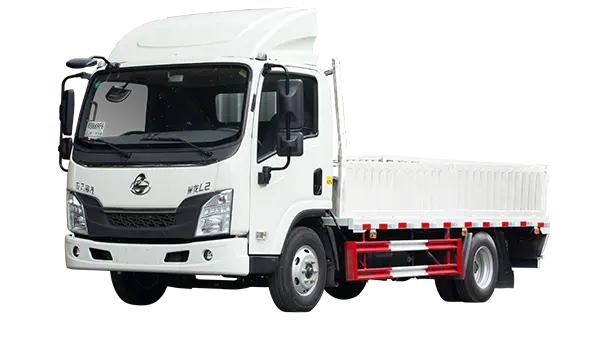 Light Truck L2
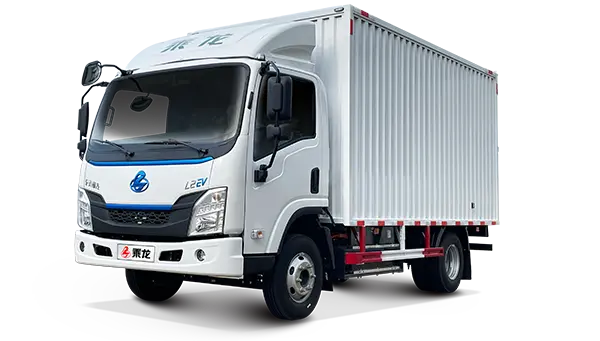 Light Truck L2 EV
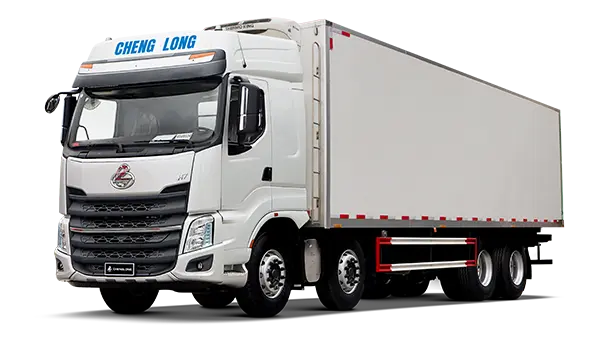 H7 Refrigeratior Truck
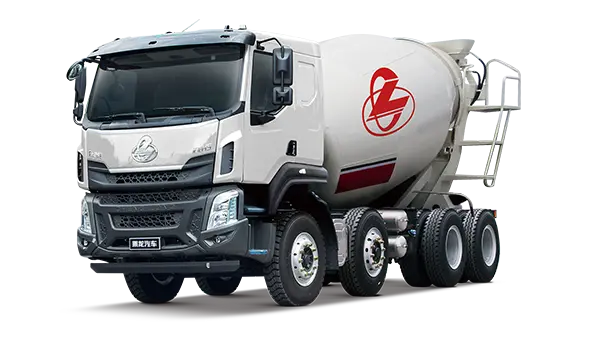 H5 Mixer Truck
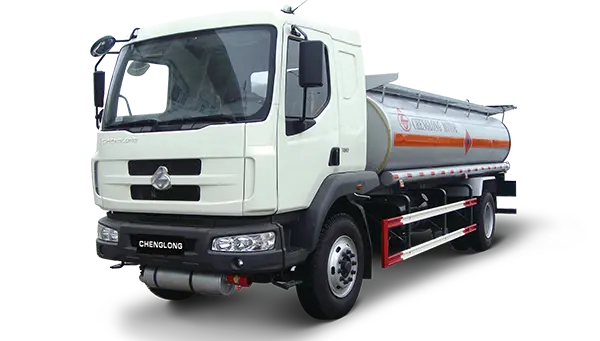 M3 Tank Truck
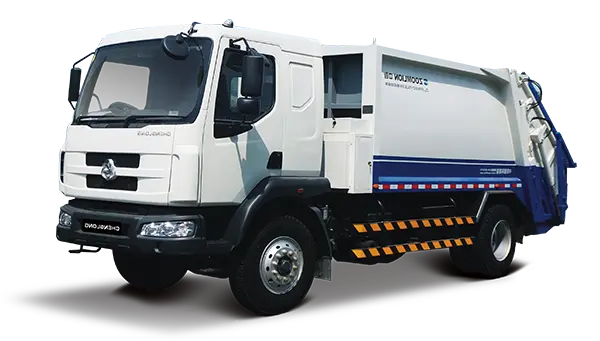 M3 Sanitation Truck
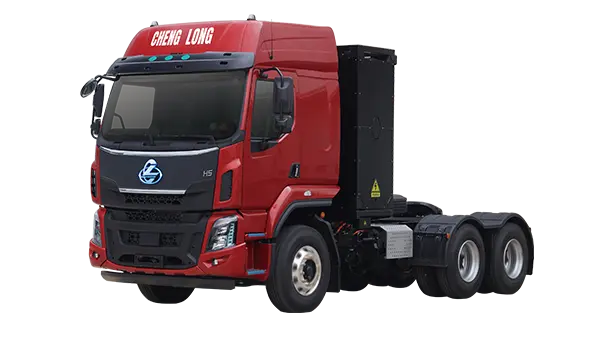 6X4 H7 Electric Truck
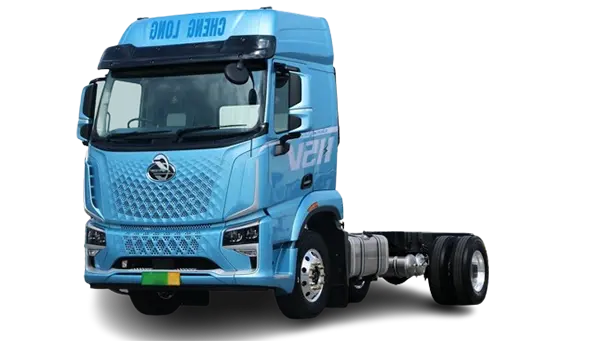 4X2 H5V Electric Truck
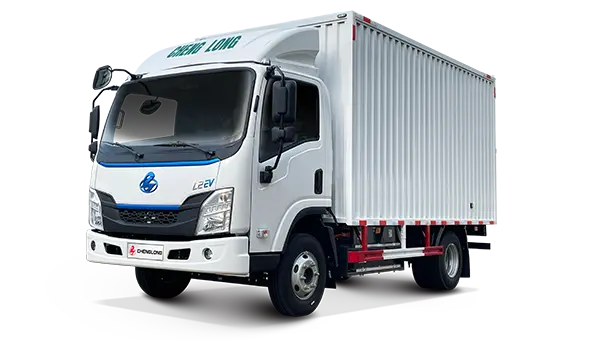 4X2 L2 Electric Truck